Gathering Data
Some datasets available on the website are suitable for meeting needs (either a single season or only up to 2020). Therefore, in order to get the latest seasons from 2020-2023, just using APIs to gather data and create datasets is a good option. Finding an API calls api-football from the rapidapi'‘s website and using it to get all the data. This API provides rich data of La Liga players and clubs. Obtaining data has wonderful acquisition and accuracy. After gathering data from this API, create two unique datasets: one for players’s data, and another one for clubs’ data.
API Sample Code
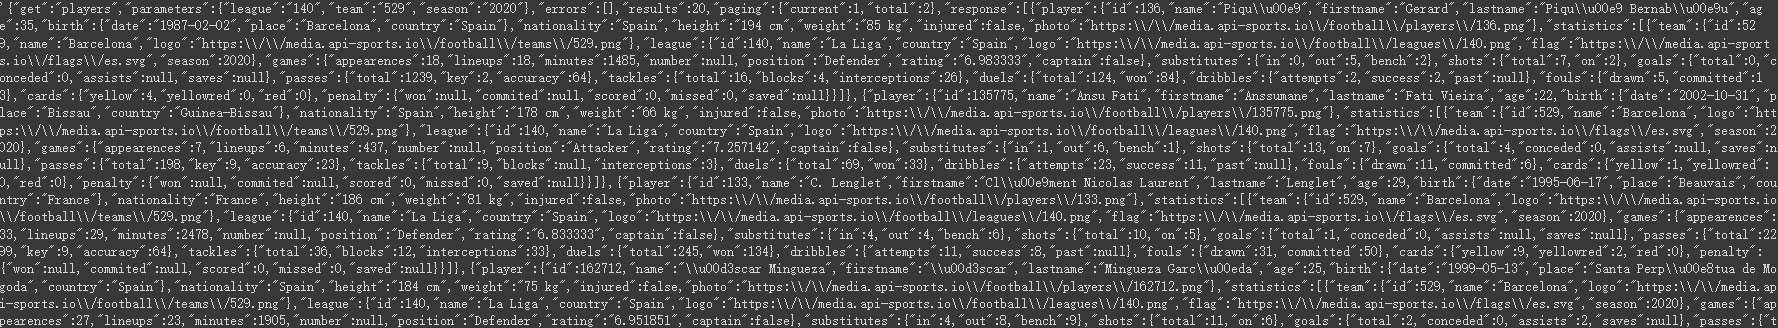
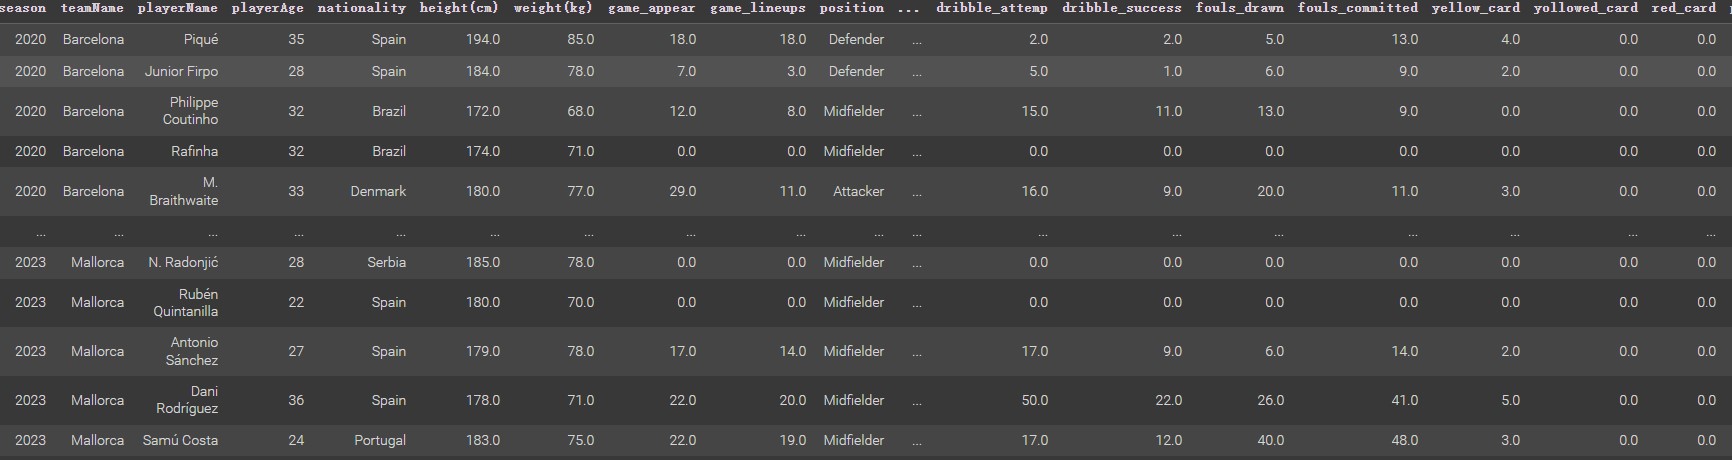
The example code below shows the API to get the various data of FC Barcelona’s players in La Liga from 2022-2023. Using this API to get all player’s data for La Liga from 2020-2023.
import requests
#endpoint
url = "https://api-football-v1.p.rapidapi.com/v3/players"

#to find the players'data in FC Barcelona 2020
# 529 means Barcelona
# 140 means Laliga
# season means 2020 year
query = {"team":"529","league":"140","season":"2020"}

headers = {
    "X-RapidAPI-Key": Your_key, # Your private API key
    "X-RapidAPI-Host": "api-football-v1.p.rapidapi.com"
}

response = requests.get(url, headers=headers, params=query)
response.text
Run code, it shows the players’ data of FC Barcelona(click picture for zoom in)
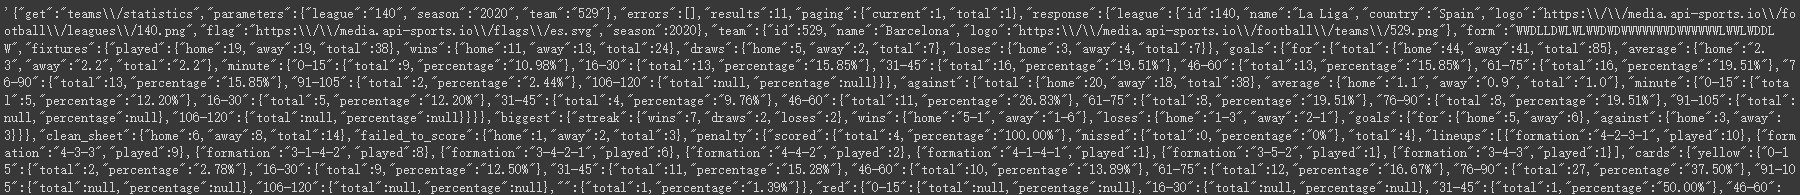
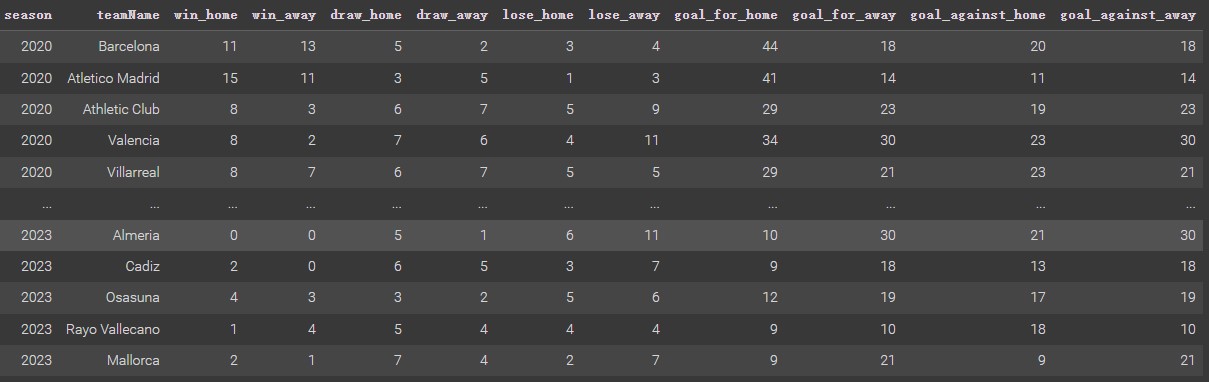
The example code below shows the API get various data of Barcelona (include wins, loses, draws, goal for, goal against, etc for each season) for La Liga from 2020-2023.
import requests

url = "https://api-football-v1.p.rapidapi.com/v3/teams/statistics"

# Getting the data of FC Barcelona in 2020
# 529 means Barcelona
# 140 means Laliga
# season means 2020 year
query = {"league":"140","season":"2020","team":"529"}

headers = {
    "X-RapidAPI-Key": Your_key,
    "X-RapidAPI-Host": "api-football-v1.p.rapidapi.com"
}

response = requests.get(url, headers=headers, params=query)
response.text
Run this sample code, it show the Barcelona’s Data in 2020 (click picture for zoom in)
Getting Raw Data
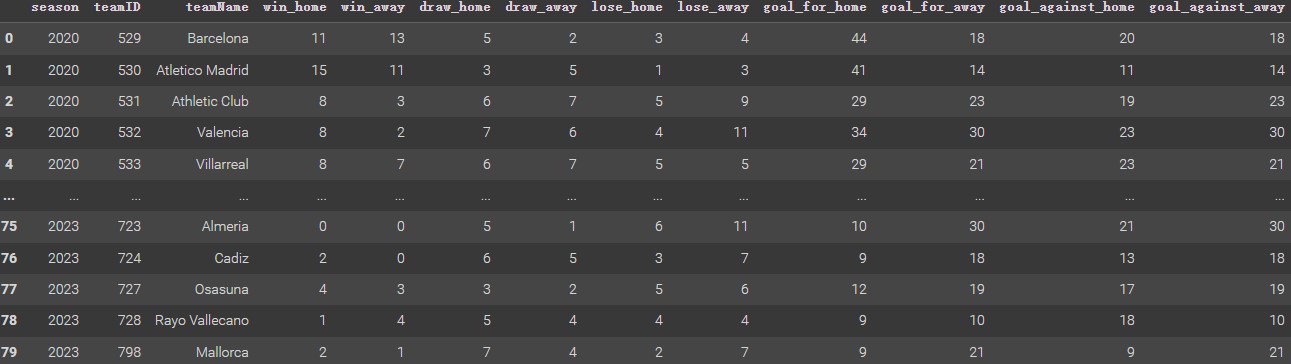
Getting the raw data from these two APIs.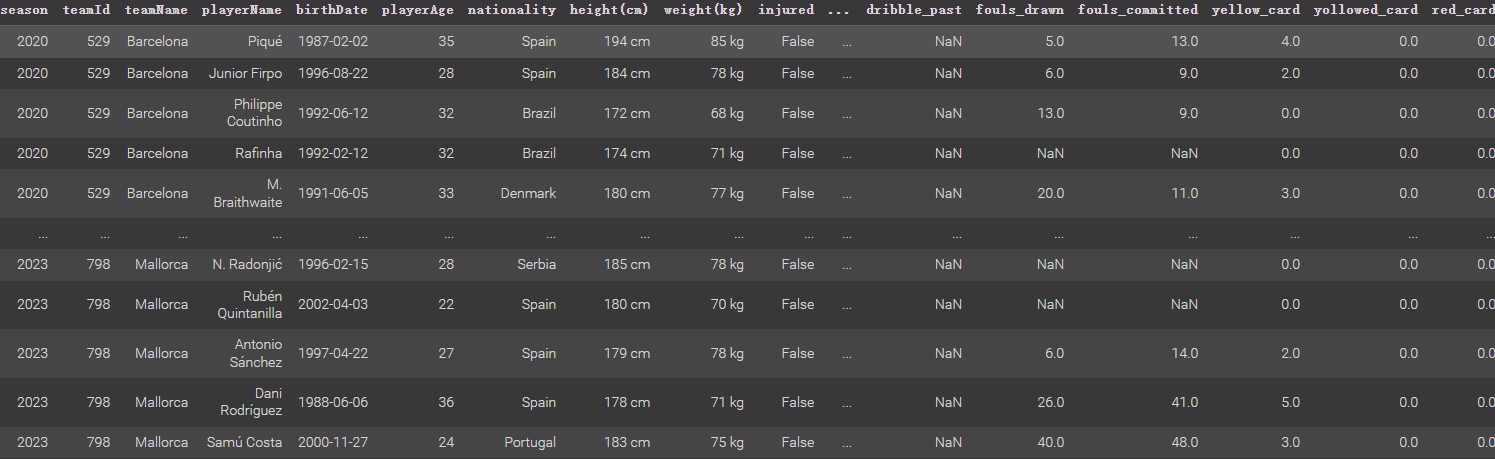
The players’ raw data have the amount of missing values, Nan, and incorrect values. Therefore, for the next step, pick a suitable way to clean/replace these values and get a clean player’s dataset.
Also, for the next step, check these two data frames data types, changing them as well to get a better analysis process and results.
Here is Full Version Code for gathering data:API Code
Full Raw Dataset of Players: Raw Dataset of Plyasers
Full Raw Dataset of Clubs: Raw Dataset of Clubs
Cleaning Data & Visualization
Cleaning
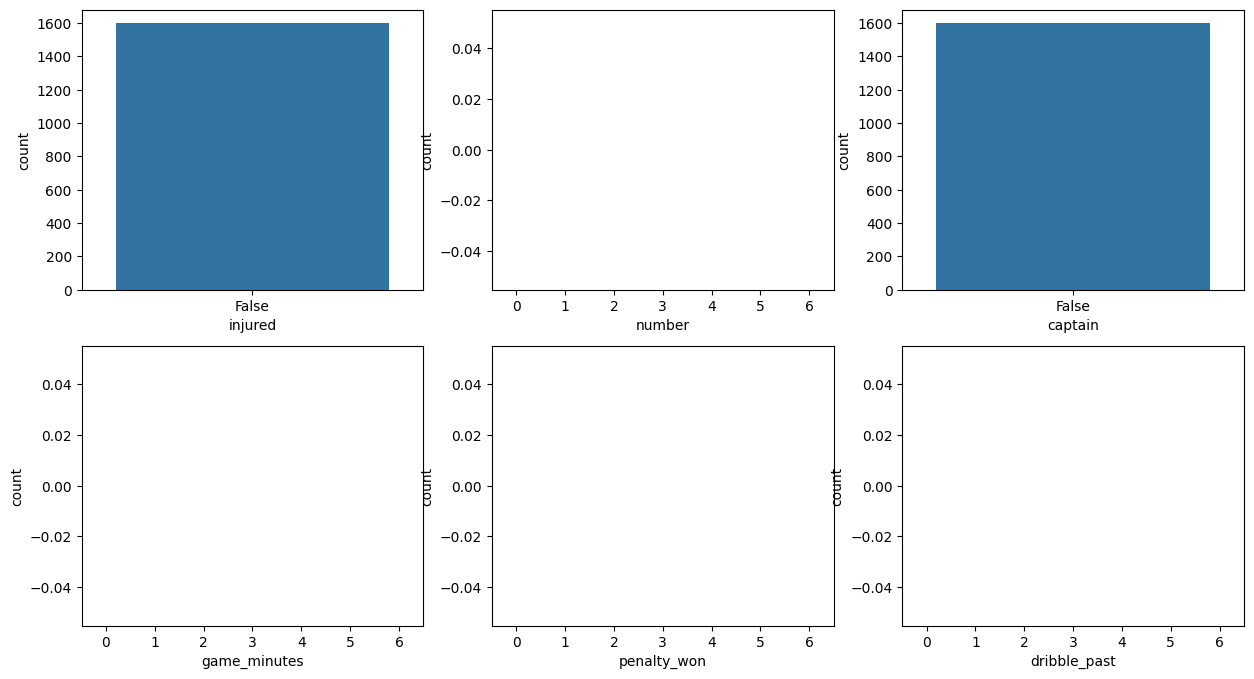
For the data cleaning step, the first thing is to remove some of the attributes that are not useful. At the same time, use countbox plots to check whether the values of those columns are all the same or all blank. The picture below shows variables of injured, number, captain, game_minutes, penalty_won, and dribble_past meet it, so they should be dropped. The teamId and birthDate are also not useful, they also should be removed. For the data club data, just drop the variable of teamID. Therefore, removing these attributes does not affect future tasks. The dataset of clubs almost perfect, it does not some NaN value, missing values, or incorrect values. Thus, dataset of clubs is clean and ready to use.
After that, searching and replacing the NaN in datasets. First, the player’s height and weight contain some NaN, and the quantity of them is small, so replacing these NaN values with height means and weight means. Other variables contain a lot of NaN data, such game_assist, goal_saved, game_appearc, etc. Because NaN is these columns mean 0, they also mean that players are not performing in these skills. Therefore, using 0 to replace NaN for these attributes is a good choice.
Last, changing some data types for the dataset, such as switching height and weight data types from string to integer. Also changing position data type from string to category.
Here is Full Version Code for Cleaning DataCleaning Data Code
Full Clean Dataset of PlayersClean Dataset of Players
Full Clean Dataset of ClubsClean Dataset of Clubs
Visualization
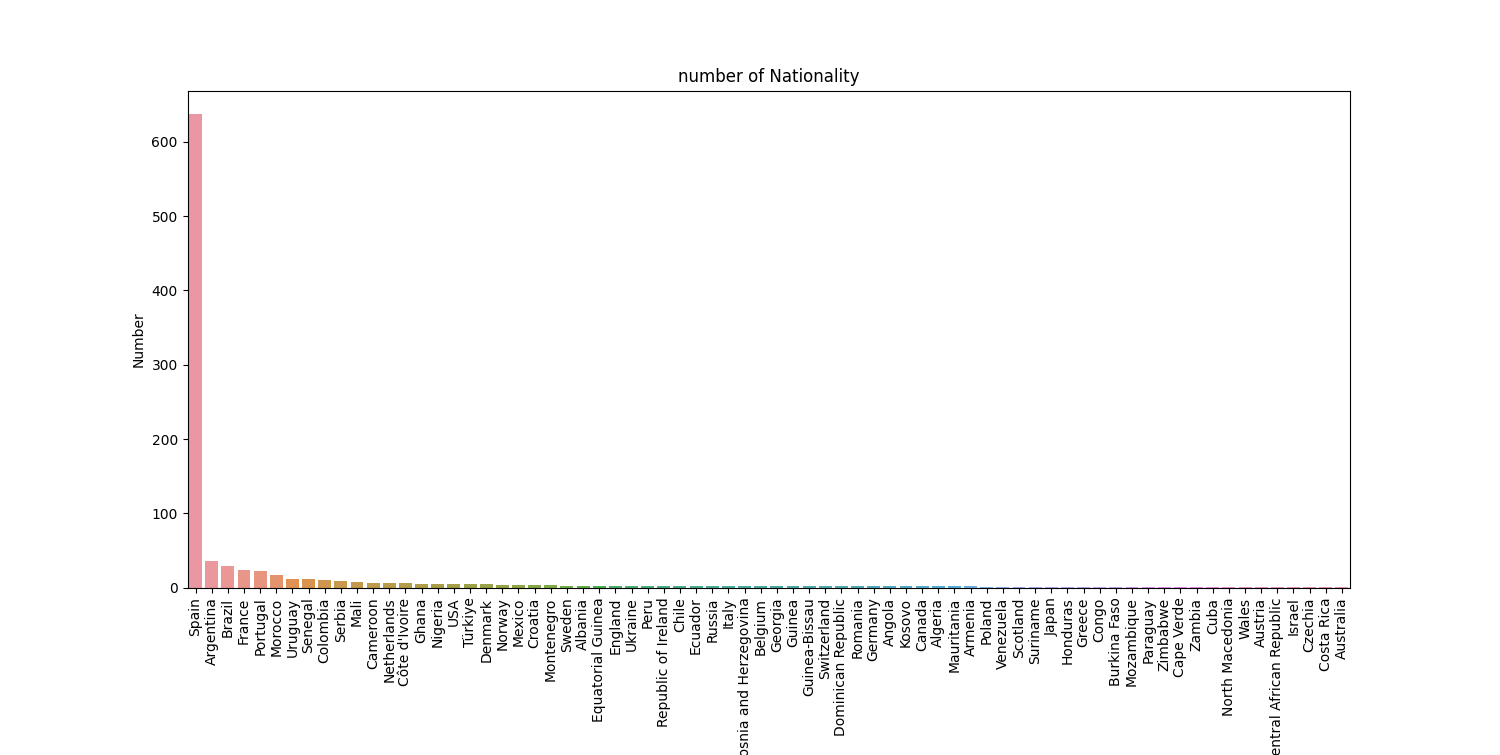
The plot shows in addition to Spanish players, Argentine, Brazilian, French, and Portuguese players play more in La Liga.
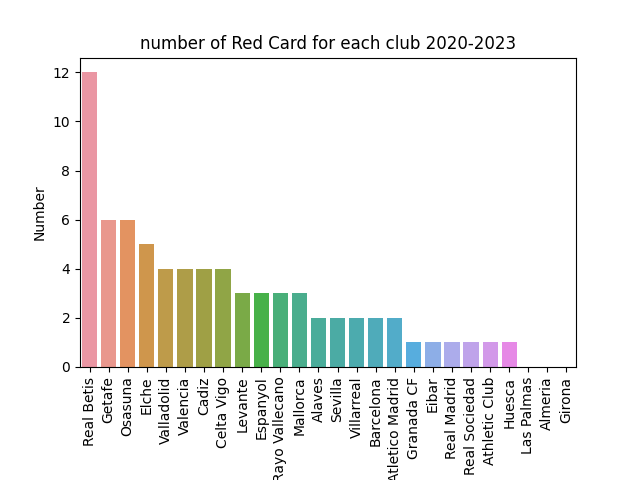
This plot shows the total number of red cards received by the various clubs in La Liga from 2020 to 2023. Clubs getting more red cards may indicate having poor results. Teams that do not get red cards may show a less aggressive style of play.
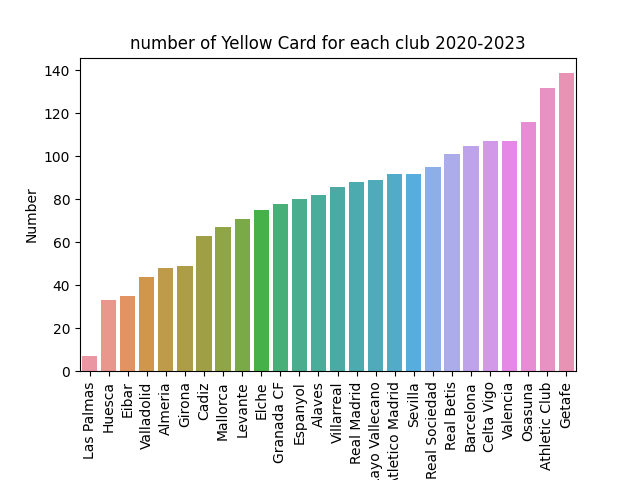
This plot shows the total number of yellow cards received by various clubs in La Liga from 2020 to 2023. The number of yellow cards received may indicate a more aggressive style of play. For example, Getafe, this team style of play is very unappealing and they get good results through a lot of fouls.
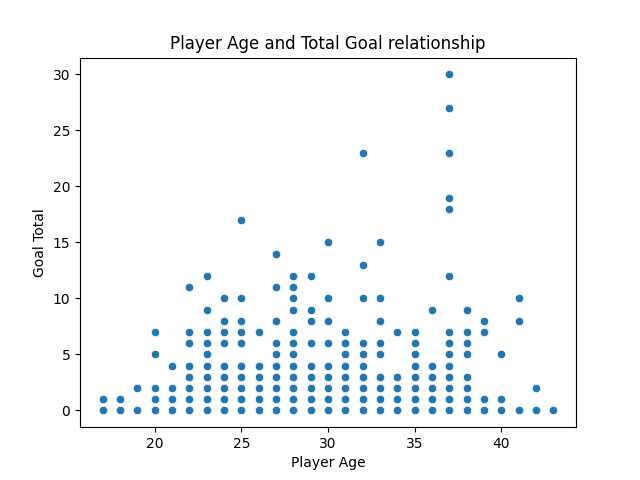
The age of players from 25 to 30 may be are golden age, they can score more goals.
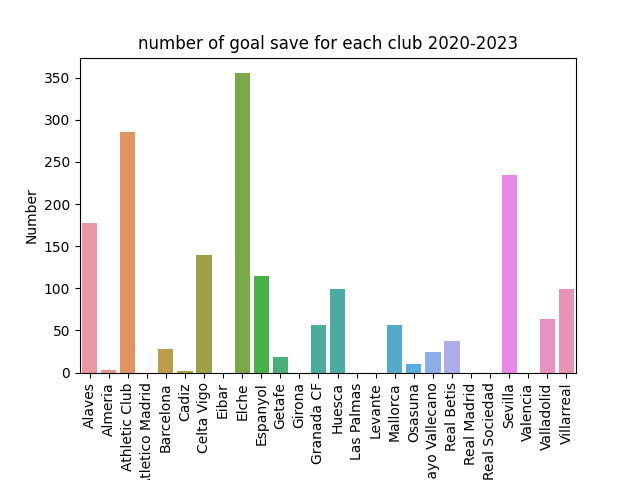
A team with more saves may indicate an inconsistent defense and may have a poor performance.
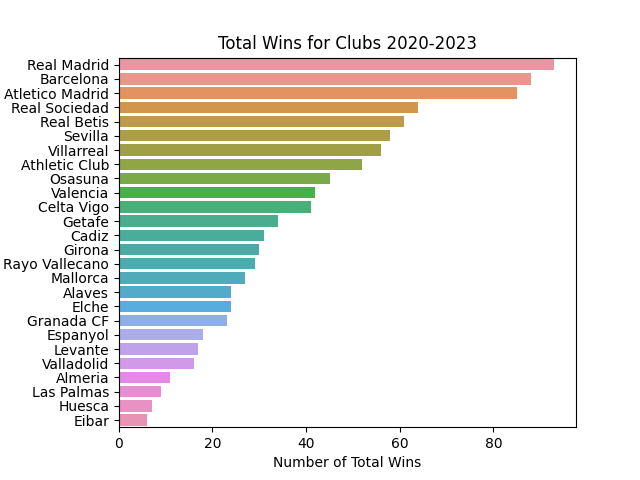
The top three teams in La Liga(Barcelona, Real Madrid, and Atletico Madrid) have won more games than any other team, which shows that they are stronger than any other team in La Liga.
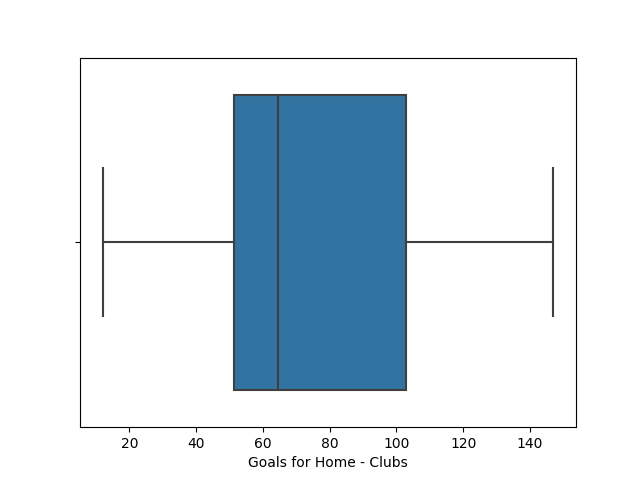
The total scored at home by each team in La Liga is generally between 50 to 110 from 2020 to 2023.
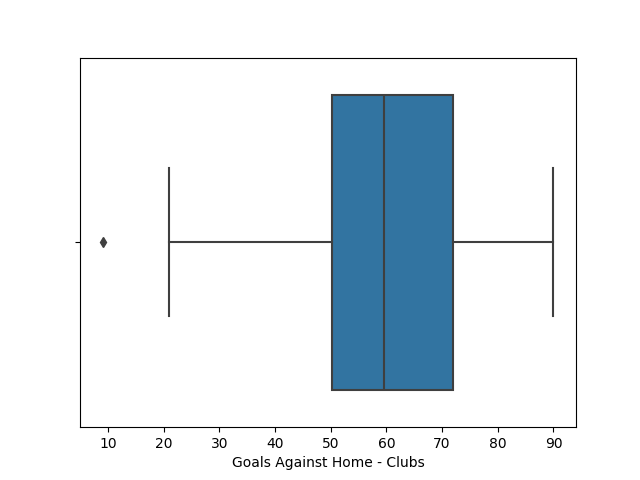
The total losses at home by each team in La Liga is generally between 50 to 70 from 2020 to 2023.
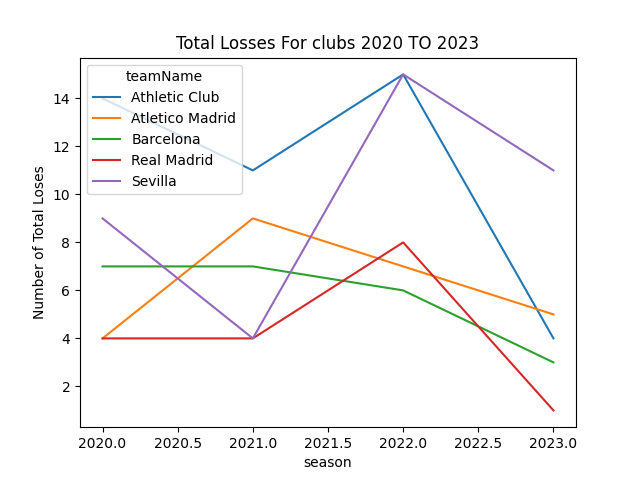
The line plot shows that Real Madrid plays the most consistently each season. Because they have fewer losses every season.
Here is Full Version Code for Data VisualizationData Visualization Code
Resource
Background & Cover Image:https://images.app.goo.gl/rrFyz3J2dLG91KgBAAPI for Gathering Data: https://rapidapi.com/api-sports/api/api-football/