K-Means Clustering
Before the k-means analysis, the appropriate K value needs to be selected. The methods used here are the Elbow method and the Silhouette method and picking two k values by them. Also, choosing another k value randomly. After that, using these k values to process k-means clustering and show the results.
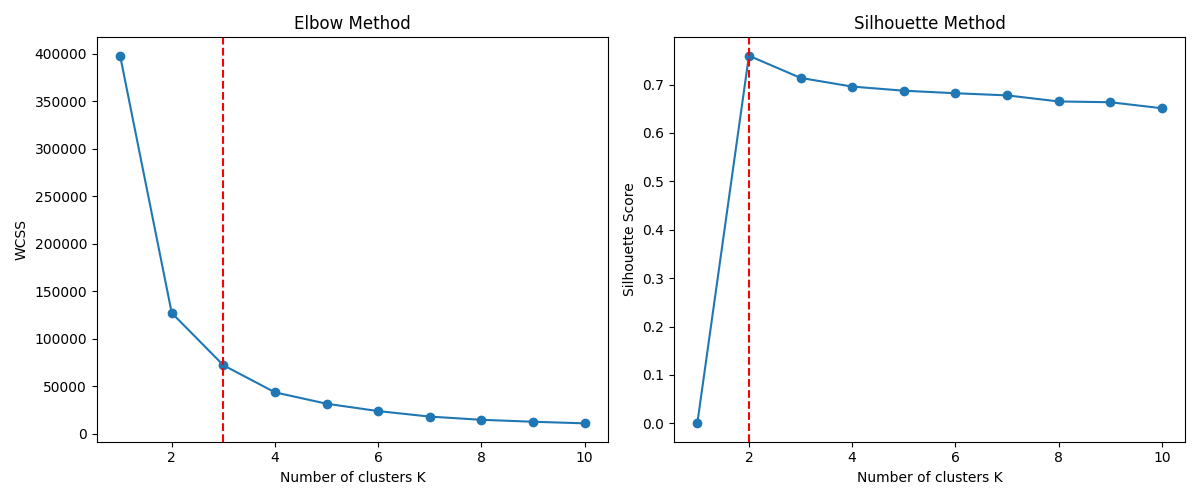
According to the optimal k-value plot above, the optimal k-value of the Elbow method is 3 and the optimal k-value of the Silhouette method is 2.
Therefore, Using k-values 2, 3, and randomly picking k-value 4 to perform K-means clustering.
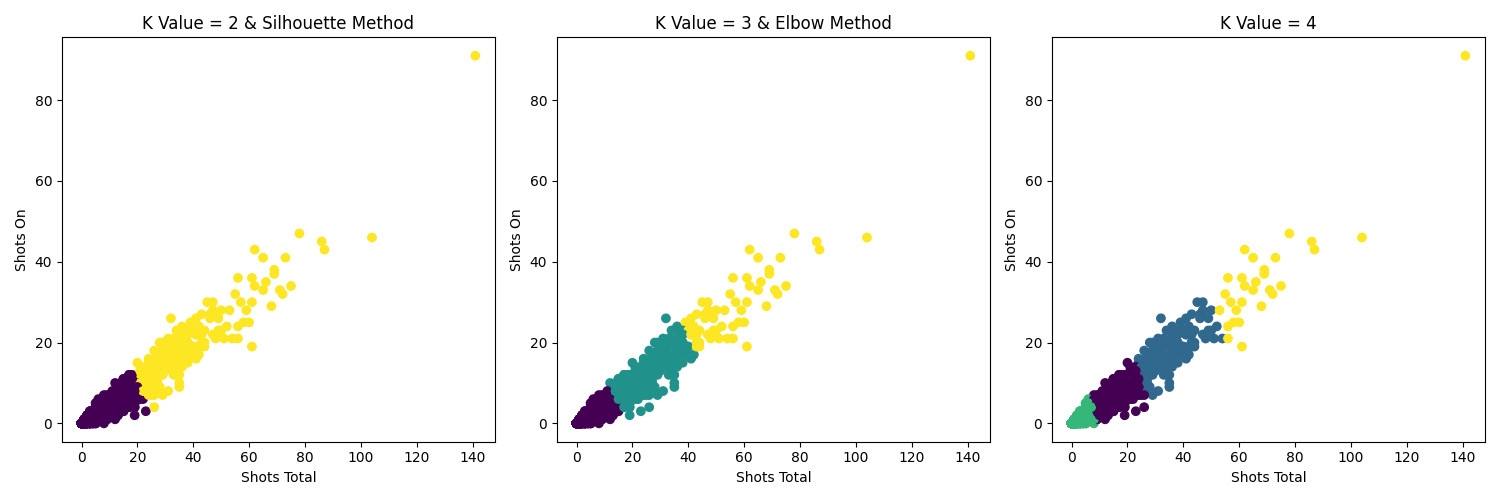
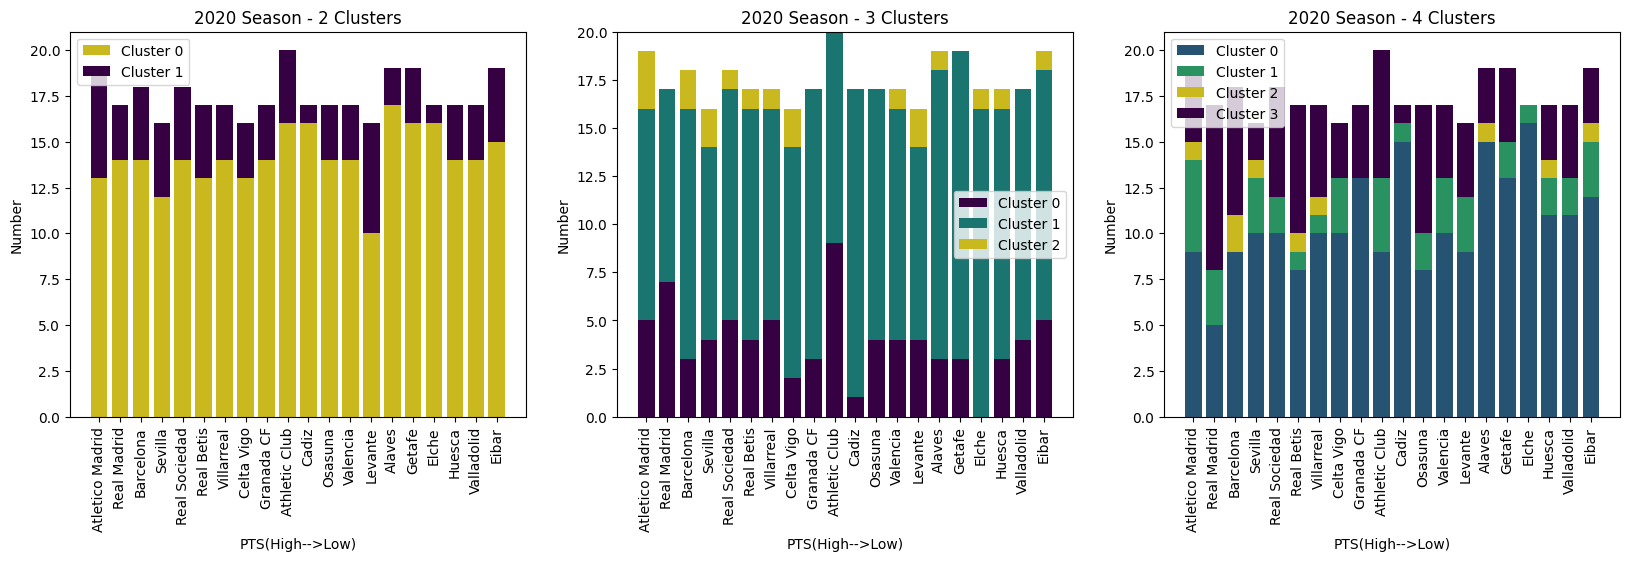
The above is the K-means cluster plot and the plot of the number of each cluster for each club in the 2020 season according to the different K-means plots. Using these two figures to determine the appropriate k value and explore the relationship between the quality of players’ shooting and the team ranking. The yellow cluster is used here to determine whether the k value is appropriate, and the yellow one represents the players with better shooting quality.
When K = 2, it shows “2020 Season – 2 clusters” in the second plot, it does not do a good job of displaying whether a player’s shooting quality is related to clubs’ ranking/wins. As mentioned above, the yellow cluster represents players with better shooting quality, while Cluster 1 represents players with average-level shooting quality. Interestingly, the three relegated clubs, Eibar, Valladolid, and Huesca, had more good quality shooting than La Liga Champions Atletico Madrid. Therefore, processing clustering analysis based on k value 2 may not be a good option.
The subplot “2020 Season – 4 Cluster” in the second figure may work better when K = 4 than K value is 2. However, it still does not do a prefect performance of showing the relationship between a players’ shooting quality and a teams’ ranking/win. For example, Barcelona has more players in the yellow cluster than Atletico Madrid, but Barce is ranked lower than Atletico Madrid.
The subplot “2020 Season – 3 Clusters” in the second plot works better when K = 3 than when K = 2 and 4. From that subplot, it is clearly obvious that Atletico Madrid has far more people in the yellow cluster than any other club. Thus, the k value is 3 is relatively effective when performing cluster analysis.
Hierarchical clustering
The following Dendrogram shows the effect of hierarchical clustering using the Cosin Similarity maximum distance calculation and the complete linkage algorithm.
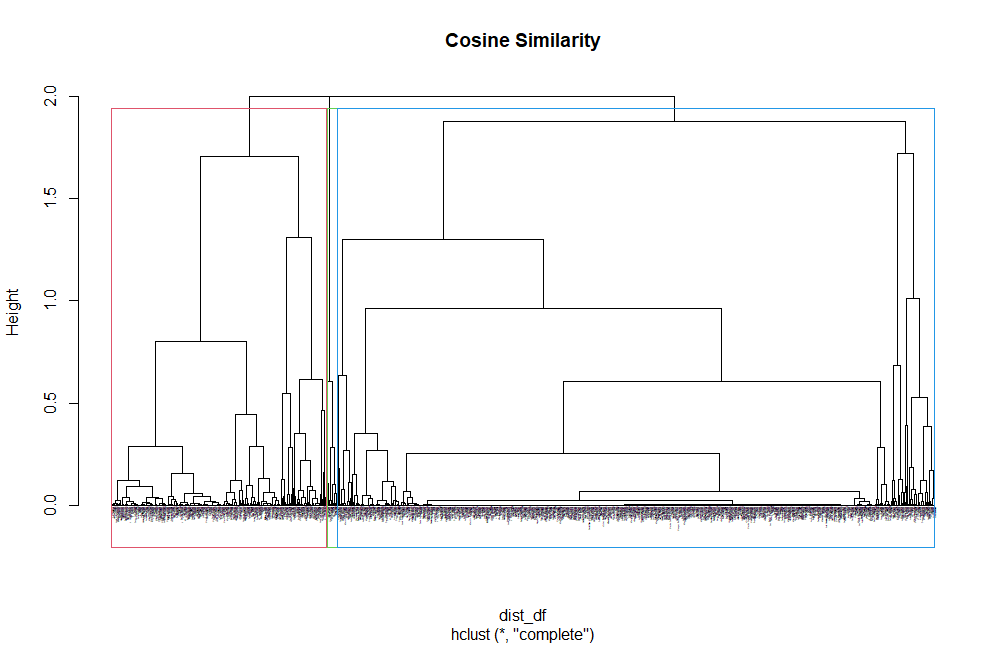
The signs shown in the plot are small and hard to read. In order to deal with this issue, using current () in R cut the tree structure by height to divide the multiple group. It is helpful to observe the clustering of the dendrogram.
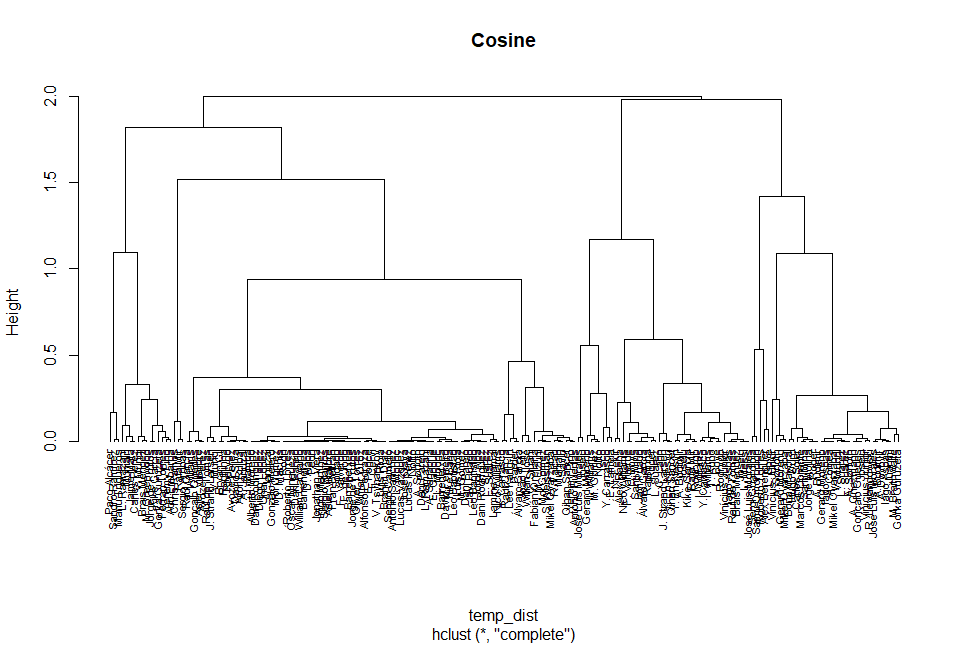
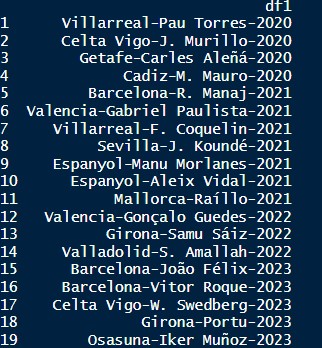
The above plot represents splitting from a height of 0.3 and displays the first group data after the division. After splitting, all of the signs of this group can be clearly seen. Therefore, this method may be able to study dendrogram in-depth. The K value cannot be determined directly by the cutoff point(height) on the tree. For example, according to the original dendrogram, choosing a height of approximately 1.8~1.9 is a good choice. Thus, the K value is 3 based on this height.
K-means and hclust comparison
After applying K-means clustering and hierarchical clustering, there are some differences between them. According to the above content, K-means can use the elbow method, silhouette method, or gap statistics to pick the best K-value, and process k-means clustering based on these K values. After that, analyze whether the player’s shooting quality is related to the clubs’ ranking of each season according to the k-means clustering results. Different from K-means, hierarchical clustering requires using cosine similarity as distance to process clustering. If you want to determine the k value based on hierarchical clustering, you may need to determine the best k value based on the cut point of the tree plot, so that data is divided into different clusters. For example, in this case, the tree is divided into clusters according to the k = 3, and the cluster the player with the best shooting quality. Comparing with the yellow cluster when k = 3 in k-means. In K-means, when k = 3, the players who appear most in the yellow cluster are Atletico Madrid players, but there is not any player of Atletico Madrid who appears in the hierarchical cluster. Therefore, if the dendrogram is clustered based on the k value, the results may be quite different from the result of K-means.